Performance comparison Ryzen vs. Intel vs. Bulldozer vs. ARM

This post has moved to eklausmeier.goip.de/blog/2021/02-01-performance-comparison-ryzen-vs-intel-vs-bulldozer-vs-arm.

For comparing different machines I invert the Hilbert matrix

H = \left(\begin{array}{ccccc}  1 & {1\over2} & {1\over3} & \cdots & {1\over n} \\                                 {1\over2} & {1\over3} & {1\over4} & \cdots & {1\over n+1} \\                                 {1\over3} & {1\over4} & {1\over5} & \cdots & {1\over n+2} \\                                 \vdots    & \vdots    & \vdots    & \ddots & \vdots \\                                 {1\over n} & {1\over n+1} & {1\over n+2} & \cdots & {1\over2n-1}         \end{array} \right)         = \left( {\displaystyle {1\over i+j-1} } \right)_{ij}

This matrix is known have very high condition numbers. Program xlu5.c stores four double precision matrices of dimension n. Matrix H and A store the Hilbert matrix, X is the identity matrix, Y is the inverse of H. Finally the maximum norm of I-H\cdot H^{-1} is printed, which should be zero. These four double precision matrices occupy roughly 1.6 MB for n=230.

1. Runtime on Ryzen, AMD Ryzen 5 PRO 3400G with Radeon Vega Graphics, max 3.7 GHz, as given by lscpu.

$ time xlu5o3b 230 > /dev/null
        real 0.79s
        user 0.79s
        sys 0
        swapped 0
        total space 0

Cache sizes within CPU are:

L1d cache:                       128 KiB
L1i cache:                       256 KiB
L2 cache:                        2 MiB
L3 cache:                        4 MiB

Required storage for above program is 4 matrices, each having 230×230 entries with double (8 bytes), giving 1692800 bytes, roughly 1.6 MB.

2. Runtime on AMD FX-8120, Bulldozer, max 3.1 GHz, as given by lscpu.

$ time xlu5o3b 230 >/dev/null 
        real 1.75s
        user 1.74s
        sys 0
        swapped 0
        total space 0

Cache sizes within CPU are:

L1d cache:                       64 KiB
L1i cache:                       256 KiB
L2 cache:                        8 MiB
L3 cache:                        8 MiB

3. Runtime on Intel, Intel(R) Core(TM) i5-4250U CPU @ 1.30GHz, max 2.6 GHz, as given by lscpu.

$ time xlu5o3b 230 > /dev/null
        real 1.68s
        user 1.67s
        sys 0
        swapped 0
        total space 0

Cache sizes within CPU are:

L1d cache:                       64 KiB
L1i cache:                       64 KiB
L2 cache:                        512 KiB
L3 cache:                        3 MiB

Apparently the Ryzen processor can outperform the Intel processor on cache, higher clock frequency. But even for smaller matrix sizes, e.g., 120, the Ryzen is two times faster.

Interestingly, the error in computations are different!

AMD and Intel machines run ArchLinux with kernel version 5.9.13, gcc was 10.2.0.

4. Runtime on Raspberry Pi 4, ARM Cortex-A72, max 1.5 GHz, as given by lscpu.

$ time xlu5 230 > /dev/null
        real 4.37s
        user 4.36s
        sys 0
        swapped 0
        total space 0

Linux 5.4.83 and GCC 10.2.0.

5. Runtime on Odroid XU4, Cortex-A7, max 2 GHz, as given by lscpu.

$ time xlu5 230 > /dev/null
        real 17.75s
        user 17.60s
        sys 0
        swapped 0
        total space 0

So the Raspberry Pi 4 is clearly way faster than the Odroid XU4.

Calling C from Julia

This post has moved to eklausmeier.goip.de/blog/2020/06-23-calling-c-from-julia.

Two ways to compute the error function or Bessel function in Julia.

1. Calling C. On UNIX libm provides erf() and j0(). So calling them goes like this:

ccall(("erf","libm.so.6"),Float64,(Float64,),0.1)
ccall(("j0"),Float64,(Float64,),3)

In this case one can omit the reference to libm.so. Watch out for the funny looking (Float64,).

2. Using Julia. SpecialFunctions.jl provides erf() and besselj0.

import Pkg
Pkg.add("SpecialFunctions")
import SpecialFunctions
SpecialFunctions.erf(0.1)
SpecialFunctions.besselj0(3)

Performance Comparison Pallene vs. Lua 5.1, 5.2, 5.3, 5.4 vs. C

This post has moved to eklausmeier.goip.de/blog/2020/05-14-performance-comparison-pallene-vs-lua-5-1-5-2-5-3-5-4-vs-c.

Installing Pallene is described in the previous post: Installing Pallene Compiler. In this post we test the performance of Pallene versus C, Lua 5.4, and LuaJIT. Furthermore we benchmark different Lua versions starting with Lua 5.1 up to 5.4.

1. Array Access. I checked a similar program as in Performance Comparison C vs. Lua vs. LuaJIT vs. Java.

function lua_perf(N:integer, S:integer)
        local t:{ {a:float, b:float, f:float} } = {}

        for i = 1, N do
                t[i] = {
                        a = 0.0,
                        b = 1.0,
                        f = i * 0.25
                }
        end

        for j = 1, S-1 do
                for i = 1, N-1 do
                        t[i].a = t[i].a + t[i].b * t[i].f
                        t[i].b = t[i].b - t[i].a * t[i].f
                end
                --io_write( t[1].a )
        end
end

This program, which does no I/O at all, runs in 0.14s, and therefore runs two times slower than the LuaJIT, which finishes in 0.07s. This clearly is somewhat disappointing. Lua 5.4, as part of Pallene, needs 0.75s. So Pallene is roughly five times faster than Lua.
Continue reading

Performance Comparison in Computing Exponential Function

This post has moved to eklausmeier.goip.de/blog/2020/05-05-performance-comparison-in-computing-exponential-function.

If your computation is dominated by exponential function evaluations, then it makes a significant difference whether you evaluate the exponential function exp() in single precision or in double precision. You can reduce your computing time by roughly 25% when moving from double precision (double) to single precision (float). Evaluation in quadruple precision is more than six times more expensive than evaluation in double precision.

Changing from double precision to single precision also halves the amount of storage needed. On x86_64 Linux float usually occupies 4 bytes, double occupies 8 bytes, and long double needs 16 bytes.

1. Result. Here are the runtime numbers of a test program.

  1. Single precision (float): 2.44s
  2. Double precision (double): 3.32s
  3. Quadruple precision (long double): 22.88s

These numbers are dependant on CPU internal scheduling, see CPU Usage Time Is Dependant on Load.

2. Test program. The test program is essentially as below:

long i, rep=1024, n=65000;
int c, precision='d';
float sf = 0;
double sd = 0;
long double sq = 0;
...
switch(precision) {
case 'd':
        while (rep-- > 0)
                for (i=0; i<n; ++i)
                        sd += exp(i % 53) - exp((i+1) % 43) - exp((i+2) % 47) - exp((i+3) % 37);
        printf("sd = %f\n",sd);
        break;
case 'f':
        while (rep-- > 0)
                for (i=0; i<n; ++i)
                        sf += expf(i % 53) - expf((i+1) % 43) - expf((i+2) % 47) - expf((i+3) % 37);
        printf("sf = %f\n",sf);
        break;
case 'q':
        while (rep-- > 0)
                for (i=0; i<n; ++i)
                        sq += expl(i % 53) - expl((i+1) % 43) - expl((i+2) % 47) - expl((i+3) % 37);
        printf("sq = %Lf\n",sq);
        break;
}

Full source code is in GitHub, file in question is called exptst.c.

3. Environment.AMD Bulldozer FX-8120, 3.1 GHz, Arch Linux 5.6.8, gcc version 9.3.0. Compiled the code with -O3 -march=native

J-Pilot Plugin For SQLite Export

This post has moved to eklausmeier.goip.de/blog/2020/04-29-j-pilot-plugin-for-sqlite-export.

In SQL Datamodel For J-Pilot I described the SQLite datamodel. I wrote a J-Pilot plugin which can export the below entities and write them to an SQLite database file. The direction is one-way: from J-Pilot to SQLite.

  1. Address
  2. Datebook
  3. Memo
  4. To-Do
  5. Expense
  6. Various categories for above entities

Adding more entities is pretty easy. For example, if people need the Calendar Palm database exported, this can be implemented quickly. We use the usual SQLite API with sqlite3_exec(), and sqlite3_prepare(), sqlite3_bind(), sqlite3_step(), and finally sqlite3_finalize().

The general mechanics of a J-Pilot plugin are described by Judd Montgomery, the author of J-Pilot, in this document. I took the Expense/expense.c source code from the Expense plugin as a guide.

The plugin provides the following functionality:

  1. Create new database from scratch, it is called jptables.db
  2. Export above mentioned entities
  3. In debug mode you can use J-Pilot‘s search to search in the SQLite database

If you call jpilot -d then debug-mode is activated.

Installation.

  1. Compile single source code file jpsqlite.c
  2. Copy library (.so file) in plugin directory ($HOME/.jpilot/plugins)
  3. Copy datamodel SQL file jptables.sql into plugin directory

Compilation is with below command:

gcc `pkg-config -cflags-only-I gtk+-2.0` -I <J-Pilot src dir> -s -fPIC -shared jpsqlite.c -o libjpsqlite.so -lsqlite3

For this to work you need the Pilot-Link header files and the J-Pilot (AUR) source code at hand.

Running the plugin: go to the plugins menu by main-menu selection or function key (F7 in my case), then press SQL button. All previous data is completey erased in the database, then all data is written to database within a single transaction.

In debug mode and in debug mode only, the “J-Pilot search” also searches through all entities in the SQLite database.

The long-term goal is that SQLite is the internal data structure for J-Pilot, thereby abandoning the binary files entirely.

Parallelization and CPU Cache Overflow

This post has moved to eklausmeier.goip.de/blog/2018/02-06-parallelization-and-cpu-cache-overflow.

In the post Rewriting Perl to plain C the runtime of the serial runs were reported. As expected the C program was a lot faster than the Perl script. Now running programs in parallel showed two unexpected behaviours: (1) more parallelizations can degrade runtime, and (2) running unoptimized programs can be faster.

See also CPU Usage Time Is Dependant on Load.

In the following we use the C program siriusDynCall and the Perl script siriusDynUpro which was described in above mentioned post. The program or scripts reads roughly 3GB of data. Before starting the program or script all this data has been already read into memory by using something like wc or grep.

1. AMD Processor. Running 8 parallel instances, s=size=8, p=partition=1(1)8:

for i in 1 2 3 4 5 6 7 8; do time siriusDynCall -p$i -s8 * > ../resultCp$i & done
real 50.85s
user 50.01s
sys 0

Merging the results with the sort command takes a negligible amount of time

sort -m -t, -k3.1 resultCp* > resultCmerged

Best results are obtained when running just s=4 instances in parallel:

$ for i in 1 2 3 4 ; do /bin/time -p siriusDynCall -p$i -s4 * > ../dyn4413c1p$i & done
real 33.68
user 32.48
sys 1.18

Continue reading

Rewriting Perl to plain C

This post has moved to eklausmeier.goip.de/blog/2018/01-30-rewriting-perl-to-plain-c.

Perl script was running too slow. Rewriting it in C made it 20 times faster.

1. Problem statement. Analyze call-tree dependency in COBOL programs. There are 77 million lines of COBOL code in ca. 30,000 files. These 30,000 COBOL programs could potentially include 74,000 COPY-books comprising 10 million lines of additional code. COBOL COPY-books are analogous to C header-files. So in total there are around 88 million lines of COBOL code. Just for comparison: the Linux kernel has ca. 20 million lines of code.

COBOL program analysis started with a simple Perl script. This Perl script is less than 200 lines, including comments. This script produced the desired dependency information.

Wading through all this COBOL code took up to 25 minutes in serial mode, and 13 minutes using 4 cores on an HP EliteBook notebook using Intel Skylake i7-6600U clocked 2.8 GHz. It took 36 minutes on an AMD FX-8120 clocked with 3.1 GHz. This execution time was deemed too long to see any changes in the output changing something in the Perl script. All runs are on Arch Linux 4.14.11-1 SMP PREEMPT.

2. Result. Rewriting the Perl script in C resulted in a speed improvement of factor 20 when run in serial mode, i.e., run times are now 110s on one core. It runs in 32s when using 8 cores on an AMD FX-8120. C program uses taylormade hashing routines.
Continue reading

Hashing with Iterator in C

This post has moved to eklausmeier.goip.de/blog/2018/01-23-hashing-with-iterator-in-c.

Many scripting languages, like Awk, Perl, Python, Lua, and so on, have hash-tables already built-in. I needed hashing functionality similar to Perl’s hash-variables. In particular I needed lookup, insert, and iterating over all entries.

I wrote on hashing in Hashing Just Random Numbers and Hash functions: An empirical comparison — article by Peter Kankowski. See also Revisiting hash table performance, or TommyDS: a C library of hashtables and tries.

1. Structure. Each hash element contains a key and a value. Additionally there is an indicator whether storage allocation using malloc() for key and value are done during hash insert, or are done elsewhere, e.g., constant strings. All hash elements having the same hash value, see below, are inserted into a singly linked list. Additionally all elements are part of singly linked list.

struct hashElem {
        int dup;        // memory ownership: 0, 0x01, 0x02, 0x03
        char *key, *val;
        struct hashElem *next;  // next hash element with same key or NULL
        struct hashElem *nextAll;       // for iterator over all hash entries
};

There is a hash header which contains the start of the list, and the actual table.

typedef struct {
        int size, collisions, load;
        const char *name;       // only for diagnostic and debugging
        struct hashElem **tab;  // hash table with size times (hashElem*)
        struct hashElem *first; // first element in hash
} hash_t;

Continue reading

C Pointer Surprises

This post has moved to eklausmeier.goip.de/blog/2017/07-17-c-pointer-surprises.

An article by Krister Walfridsson on C pointers are not hardware pointers demonstrated that even adjacent integer variables having the same hardware address may compare unequal regarding C pointers.

See the following C program:

#include <stdio.h>

int main(int argc, char *argv[]) {
        int x, y;
        int *p = &x + 1;
        int *q = &y;
        printf("%p %p %d\n", (void*)p, (void*)q, p == q);
        return 0;
}

You have to compile with optimization enabled, e.g., cc -O3. Otherwise gcc adds some stuff between variables. On AMD/Intel/ARM CPUs the output looks something like this:

0xbe849afc 0xbe849afc 0

I.e., the pointers point to the same address, but the pointer comparison gives “false”.

Added 06-Aug-2017: As hinted by the comment given by Ashwin Nanjappa below, the compiler actually does not generate compare instructions, but rather just adds 0=false.

Disassembling

$ cc -Wall -O3 -c ptrcomp.c
$ objdump -d ptrcomp.o

gives

ptrcomp.o:     file format elf64-x86-64

Disassembly of section .text.startup:

0000000000000000 <main>:
   0:   48 83 ec 18             sub    $0x18,%rsp
   4:   48 8d 3d 00 00 00 00    lea    0x0(%rip),%rdi        # b <main+0xb>
   b:   31 c9                   xor    %ecx,%ecx
   d:   48 8d 54 24 04          lea    0x4(%rsp),%rdx
  12:   64 48 8b 04 25 28 00    mov    %fs:0x28,%rax
  19:   00 00
  1b:   48 89 44 24 08          mov    %rax,0x8(%rsp)
  20:   31 c0                   xor    %eax,%eax
  22:   48 89 d6                mov    %rdx,%rsi
  25:   e8 00 00 00 00          callq  2a <main+0x2a>
  2a:   48 8b 4c 24 08          mov    0x8(%rsp),%rcx
  2f:   64 48 33 0c 25 28 00    xor    %fs:0x28,%rcx
  36:   00 00
  38:   75 07                   jne    41 <main+0x41>
  3a:   31 c0                   xor    %eax,%eax
  3c:   48 83 c4 18             add    $0x18,%rsp
  40:   c3                      retq
  41:   e8 00 00 00 00          callq  46 <main+0x46>

Xoring oneself gives zero.

Text Analysis using Concordance

This post has moved to eklausmeier.goip.de/blog/2017/06-26-text-analysis-using-concordance.

When analyzing longer text, especially if this text was written by oneself, it helps to read the text in a different way, here using a concordance.

Assume your text is provided as PDF. Convert PDF to text using pdftotext, which is part of package poppler. Replace line breaks in text file with spaces using below C program (called linebreak.c):

#include 

int main(int argc, char *argv[]) {
        int c, flag=0;
        FILE *fp;

        if (argc >= 2) {
                if ((fp = fopen(argv[1],"rb")) == NULL)
                        return 1;
        } else {
                fp = stdin;
        }

        while ((c = fgetc(fp)) != EOF) {
                if (c == '\n') {
                        flag += 1;
                        if (flag > 1) { putchar(c); flag = 0; }
                        else putchar(' ');
                } else {
                        flag = 0;
                        putchar(c);
                }
        }

        return 0;
}

Then generate a list of (single) words with below Perl program:

#!/bin/perl -W
# Print word concordances

use strict;

my (%H,@F);

while () {
        chomp;
        s/\s+$//;       # rtrim
        @F = split;
        foreach my $w (@F) {
                $w =~ s/^\s+//; # ltrim
                $w =~ s/\s+$//; # rtrim
                $H{$w} += 1;
        }
}

foreach my $w (sort keys %H) {
        printf("\t%6d\t%s\n",$H{$w},$w);
}

To print all word pairs replace above loop with

while () {
        chomp;
        s/\s+$//;       # rtrim
        @F = split;
        for(my $i=0; $i<$#F; ++$i) {
                $F[$i] =~ s/^\s+//;     # ltrim
                $F[$i] =~ s/\s+$//;     # rtrim
                $F[$i+1] =~ s/^\s+//;   # ltrim
                $F[$i+1] =~ s/\s+$//;   # rtrim
                $H{$F[$i] . " " . $F[$i+1]} += 1;
        }
}

Similar, for word triples replace the loop with

while () {
        chomp;
        s/\s+$//;       # rtrim
        @F = split;
        for(my $i=0; $i+1<$#F; ++$i) {
                $F[$i] =~ s/^\s+//;     # ltrim
                $F[$i] =~ s/\s+$//;     # rtrim
                $F[$i+1] =~ s/^\s+//;   # ltrim
                $F[$i+1] =~ s/\s+$//;   # rtrim
                $F[$i+2] =~ s/^\s+//;   # ltrim
                $F[$i+2] =~ s/\s+$//;   # rtrim
                $H{$F[$i] . " " . $F[$i+1] . " " . $F[$i+2]} += 1;
        }
}

Printing concordances using Perl hashes is very simple, as one can see.

Here is an example from the man-page of expect using below sequence of commands:

( TERM=dumb; man expect ) | linebreak | word3concord | sort -r

Truncated result is

            16  For example, the
            13  example, the following
            12  the current process.
             9  the end of
             8  using Expectk, this
             8  this option is
             8  sent to the
             8  flag causes the
             8  body is executed
             8  Expectk, this option
             8  (When using Expectk,
             7  to the current
             7  the spawn id
             7  the most recent
             7  the current process
             7  the corresponding body
             7  option is specified
             7  is specified as
             7  corresponding body is
             7  by Don Libes,
             7  be used to
             6  set for the
             6  of the current
             6  is set for
             6  is an alias

Operation Costs Measured in CPU Clock Cycles

This post has moved to eklausmeier.goip.de/blog/2016/11-22-operation-costs-measured-in-cpu-clock-cycles.

I have written on the merits of 64-bit vs 32-bit, or on the AMD Bulldozer CPU Architecture Overview. An article in ithare.com gave a very good overview about the relative performance of various CPU operations. Below is the graphic:

Not all CPU operations are created equal

Also see the often quoted Agner Fog: Instruction Tables.

GCC 6.1 Compiler Optimization Level Benchmarks

This post has moved to eklausmeier.goip.de/blog/2016/05-30-gcc-6-1-compiler-optimization-level-benchmarks.

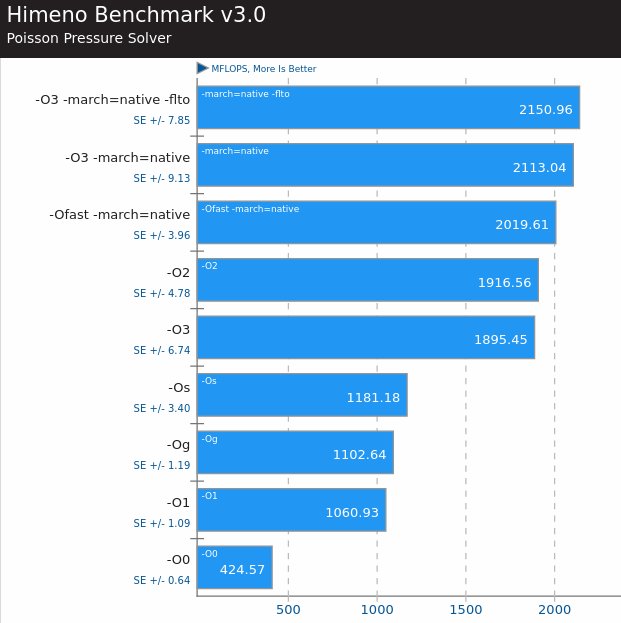
In Effect of Optimizer in gcc on Intel/AMD and Power8 I measured speed ratios between optimized and non-optimized C code of three on Intel/AMD, and eight on Power8 (PowerPC) for integer calculations. For floating-point calculations the factors were two and three, respectively.

Michael Larabel in GCC 6.1 Compiler Optimization Level Benchmarks: -O0 To -Ofast + FLTO measured various optimization flags of the newest GCC.

For a Poisson solver the speed ratio between optimized and non-optimized code was five.

HimenoBenchmarkGCC61